
Oversight: what is open, what is late, what we have already seen.
A dashboard is only useful if you believe it. This one counts as overdue only what is genuinely down to you, and it opens the door to your teams’ memory.
The state of the operation on one page.
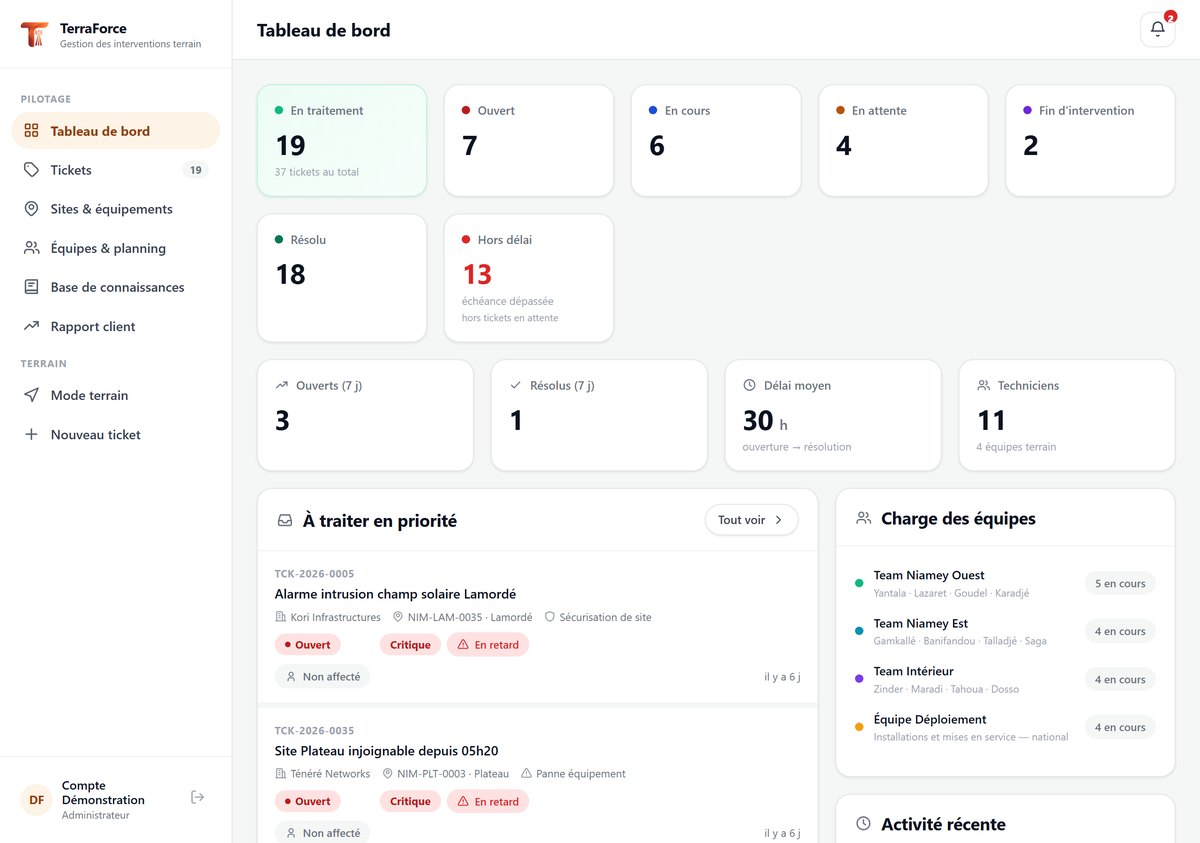
- Counters by status and overdue tickets, under the paused-clock rule
- Daily flow of openings and resolutions over seven days
- Average resolution time, by type of work and by team
- Breakdown by type of job, and recent activity
Knowledge base: what your teams already know.
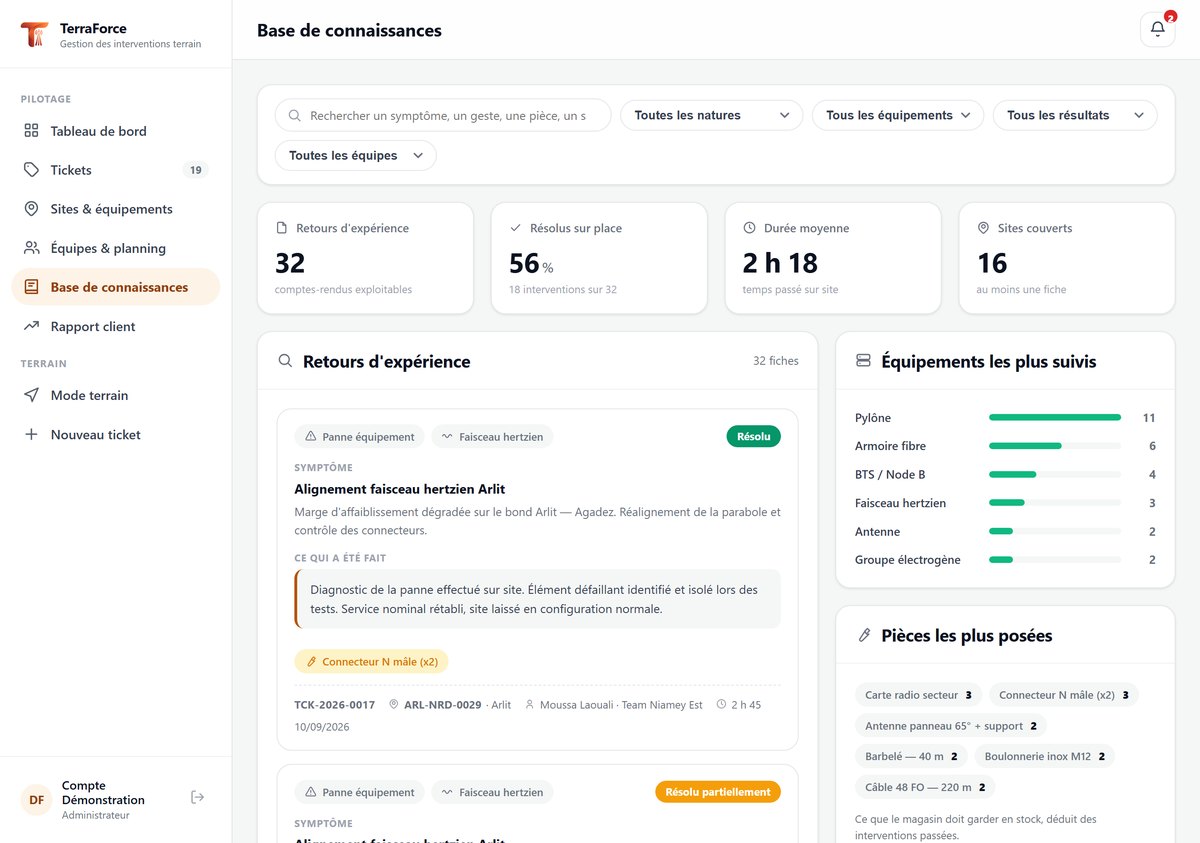
Every intervention report feeds a searchable base. The technician who fixed that fault last year may have moved on; his report has not.
Search across reports
Full text, with filters by type of work, equipment class and outcome. You search a symptom, you find what worked.
Similar cases, without searching
On every ticket, a tab surfaces comparable work on its own: same type of job, same equipment class. It is offered before departure.
Most-serviced equipment
What fails most often, and on which sites. Hardware that costs too much eventually becomes visible.
Most-fitted parts
Real consumption by equipment, useful for restocking and for supplier negotiation alike.
Reports you hand over, not reports you export.
Activity report by customer and period, export of any filtered list, work order and quotation ready to print. A filtered list link is shared as it is: the person you send it to sees exactly what you see.
See the platform run on your own cases
An hour is enough: you open a request, assign it, close it and print the signed work order. Then we look at how your operation fits in: your customers, your sites, your contractual deadlines.